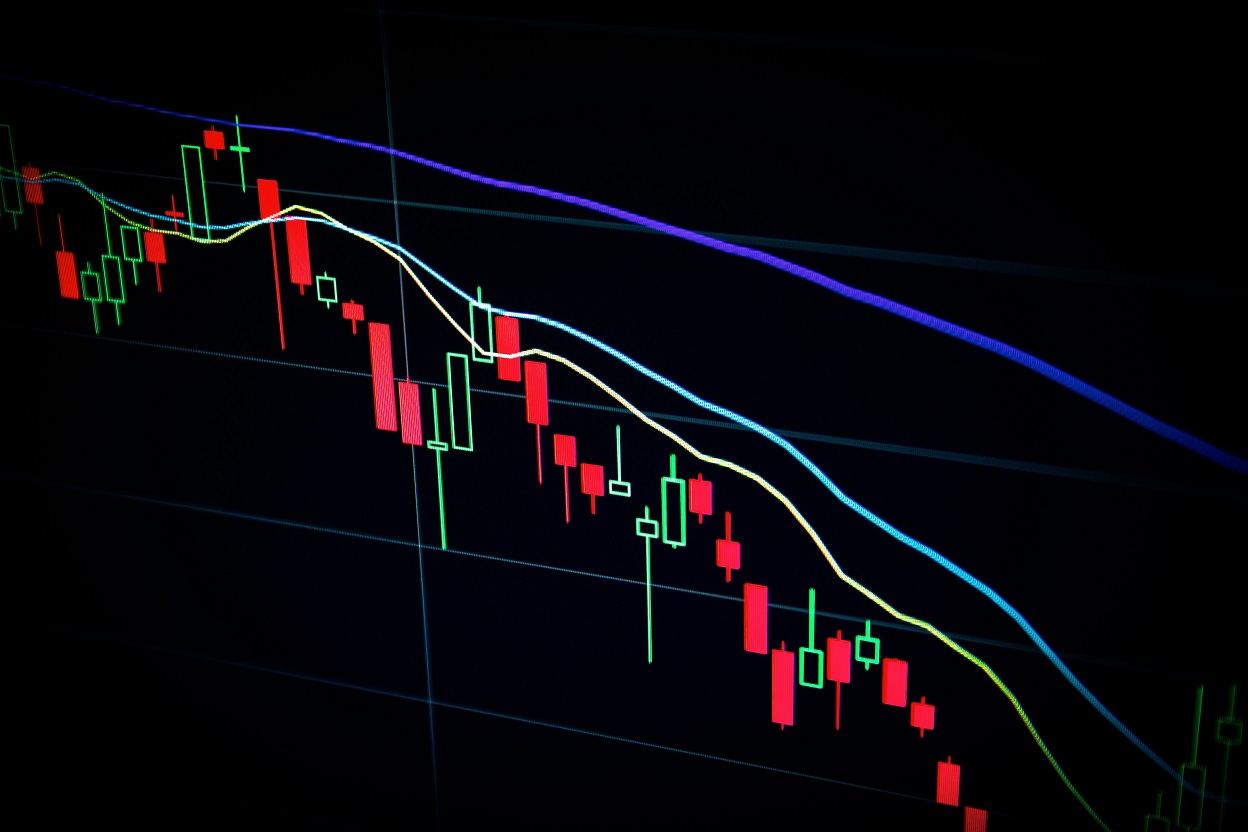
Candlestick patterns have been a staple in technical analysis for centuries, providing traders with valuable insights into market sentiment and potential price movements. In the world of Forex trading, understanding and mastering these candlestick patterns is a key skill that can enhance your ability to make informed and strategic decisions. In this guide, we’ll break down essential candlestick patterns, explaining their significance and potential implications for market trends.
Introduction to Candlestick Patterns
Candlestick charts originated in Japan in the 18th century and have since become a popular tool for traders worldwide. Each candlestick represents a specific time frame, typically a day in Forex trading. The body of the candlestick indicates the opening and closing prices, while the wicks or shadows represent the high and low prices during that period.
Common Candlestick Patterns and Their Significance
1. Doji
Significance: The Doji signals market indecision. It occurs when the opening and closing prices are virtually the same, creating a small or non-existent body. A Doji suggests a potential reversal or a transition from a trend to a period of consolidation.
2. Bullish Engulfing Pattern
Significance: This pattern consists of a small bearish candlestick followed by a larger bullish candlestick that completely engulfs the previous one. It indicates a shift in sentiment from bearish to bullish and suggests potential upward momentum.
3. Bearish Engulfing Pattern
Significance: The opposite of the bullish engulfing pattern, the bearish engulfing pattern suggests a shift from bullish to bearish sentiment. It occurs when a small bullish candlestick is followed by a larger bearish candlestick that engulfs the previous one.
4. Hammer
Significance: The hammer is a bullish reversal pattern characterized by a small body and a long lower wick. It suggests that sellers were in control initially but lost momentum, indicating a potential trend reversal.
5. Shooting Star
Significance: The shooting star is a bearish reversal pattern opposite to the hammer. It has a small body at the top of the candlestick with a long upper wick, suggesting a potential reversal from bullish to bearish.
6. Morning Star
Significance: The morning star is a bullish reversal pattern that consists of three candlesticks: a bearish candle, followed by a small-bodied candle indicating market indecision, and finally a bullish candle. It signals a potential trend reversal from bearish to bullish.
7. Evening Star
Significance: The evening star is the bearish counterpart to the morning star. It consists of a bullish candle, a small-bodied candle, and a bearish candle, signaling a potential reversal from bullish to bearish.
8. Double Top and Double Bottom
Significance: These patterns are trend reversal indicators. A double top occurs after an uptrend and suggests a potential reversal to a downtrend, while a double bottom occurs after a downtrend and signals a potential reversal to an uptrend.
Trading with Candlestick Patterns: Tips and Considerations
Confirmation is Key: While candlestick patterns provide valuable insights, it’s crucial to confirm signals with other technical indicators, trendlines, or support and resistance levels.
Multiple Time Frame Analysis: Consider analyzing candlestick patterns on multiple time frames to get a comprehensive view of market dynamics.
Combine Patterns: Look for confluence by combining different candlestick patterns or incorporating them into a broader technical analysis strategy.
Risk Management: Always implement sound risk management practices, including setting stop-loss orders and proper position sizing.
Continuous Learning: The world of Forex trading is dynamic. Stay updated on new patterns and market developments to refine your trading skills continually.
Conclusion
Mastering candlestick patterns is an essential skill for any Forex trader. By understanding the significance of these patterns and how they can indicate potential market trends, you gain a valuable tool for making informed and strategic trading decisions. Remember, like any technical analysis tool, candlestick patterns are most effective when used in conjunction with other analysis methods and a disciplined trading strategy.
Mastering Forex Swing Trading: A Proven Strategy for Success
Mastering the Forex 1-Hour Trading Strategy: A Comprehensive Guide

